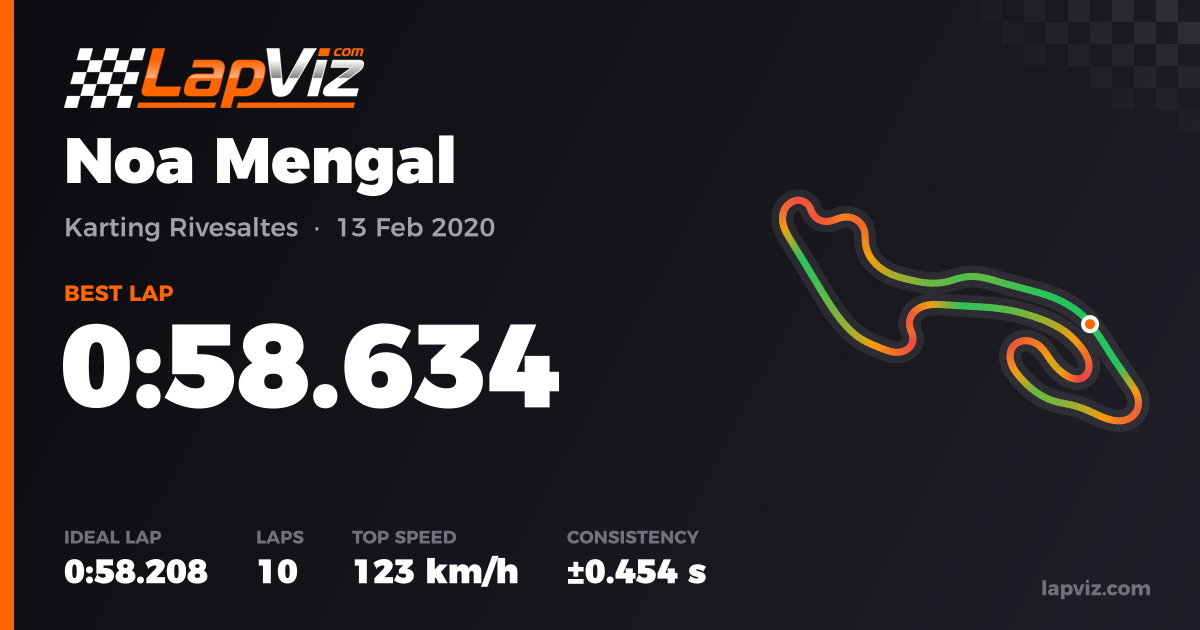



Best lap
0:58.634
Lap 5
0:58.208
Ideal lap
-0.426 s
10
Laps
62/100
Consistency (±0.454 s)
123 km/h
Top speed
-
Rank on the circuit
0
Views
Key insights
- Faster and faster: 0.113 s gained per lap over the longest stint.
- Most time lost in sector 3: 0.196 s against the best sector of the session (lap 9).
Where the best lap loses time
Against the best time of each sector in the session
S1
+0.120
S2
=
S3
+0.196
S4
+0.111
S5
=
Progress on this circuit
-
Previous best
-
This session
First session of the driver on this circuit (among the sessions you may see).
Lap times
±0.454 s
Standard deviation (0.77 %)
63 %
Laps within 1 % of the best
8 / 10
Clean laps
-0.113 s/lap (unit)
Trend (longest stint)
Laps slower than 107 % of the best (out/in laps, traffic) are left out and start a new stint. Dashed line: trend of each stint (tyre wear, fuel).
Laps
Best
Improved
Slower
| Lap | S1 | S2 | S3 | S4 | S5 | Time | Gap |
|---|---|---|---|---|---|---|---|
| 1 | 0:22.092 | 0:12.942 | 0:14.847 | 0:13.640 | 0:11.219 | 1:14.742 | +16.108 |
| 2 | 0:16.043 | 0:11.567 | 0:13.798 | 0:12.319 | 0:10.269 | 1:03.998 | +5.363 |
| 3 | 0:15.209 | 0:11.153 | 0:12.392 | 0:11.086 | 0:10.116 | 0:59.957 | +1.322 |
| 4 | 0:14.960 | 0:11.209 | 0:12.380 | 0:11.297 | 0:10.023 | 0:59.871 | +1.237 |
| 5 | 0:14.574 | 0:10.919 | 0:12.194 | 0:11.004 | 0:09.943 | 0:58.634 | |
| 6 | 0:14.459 | 0:10.927 | 0:12.205 | 0:11.132 | 0:10.151 | 0:58.876 | +0.242 |
| 7 | 0:14.509 | 0:10.992 | 0:12.413 | 0:10.893 | 0:10.103 | 0:58.912 | +0.278 |
| 8 | 0:14.574 | 0:10.939 | 0:12.753 | 0:11.029 | 0:09.966 | 0:59.263 | +0.629 |
| 9 | 0:14.454 | 0:11.036 | 0:11.998 | 0:10.908 | 0:10.522 | 0:58.919 | +0.285 |
| 10 | 0:14.731 | 0:10.945 | 0:12.192 | 0:10.969 | 0:10.169 | 0:59.007 | +0.373 |